More HR teams are telling us the same thing: "Our data team is building people analytics in Databricks, with Power BI on top." It's a reasonable plan. The company already pays for both, IT wants one platform for data, and HR data finally sits next to finance, sales, and operations data.
The platform is rarely what slows these builds down. Databricks will store and process anything you give it. Power BI will join tables, build models, and draw the charts. The slow part is everything HR-specific that has to exist before those joins return a number your CHRO will trust.
If you're planning this build, or you're a few months into one, here are the eight questions worth answering before you commit to a timeline.
1. What was headcount on March 31, really?
HR data is effective-dated. Every change has the date it takes effect and the date someone entered it, and those are often weeks apart.
Say an employee resigns effective March 15, but HR enters the termination on April 3. Your March headcount report already went out. Was it wrong?
That depends on which question you're answering, and there are two:
- As of: what was true on March 31, based on everything we know today?
- As reported: what did we believe on March 31, based on what had been entered by then?
Both are valid. Finance usually wants one, HR the other, and an audit may need both. A model that only keeps current-state snapshots can answer neither reliably. Your model needs to keep both dates on every change, and every metric needs to say which view it uses.
2. Which org chart are you reporting against?
Reorgs happen. When the CHRO asks for attrition by department over the last two years, does "department" mean the structure today, or the structure each person was in at the time they left?
Both answers are useful, and they can tell very different stories. A team that was split in two last year will look like it had zero attrition before it existed, unless the model keeps org history.
Hierarchies add their own complications. Supervisory orgs are ragged (some branches go eight levels deep, some go three), and most companies run more than one: the reporting line, cost centers, locations, and sometimes a matrix structure on top. In Power BI, parent-child hierarchies are typically flattened with path functions, and that flattened shape reflects a point in time. Keeping it correct across history is a modelling job you'll have to design and maintain.
3. Which join do you mean?
Here's a question a talent leader might reasonably ask: "For each employee who hires, what's the gender mix of the candidates applying to their roles?"
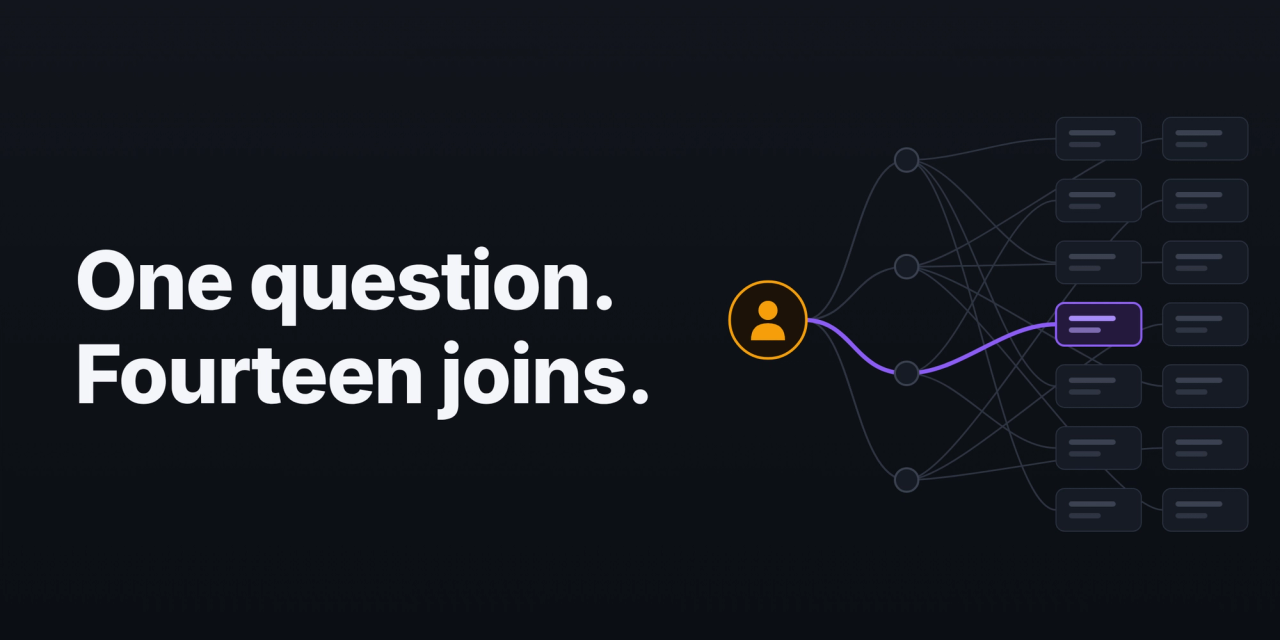
It sounds like one join: employees to requisitions to applications. In HR data, though, people connect to requisitions in many ways. Starting from a single employee record, every one of these routes is valid:
1. Employee as hiring manager. Requisitions where the employee is the hiring manager
2. Employee as recruiter. Requisitions where the employee is the recruiter
3. Employee's manager as hiring manager. Requisitions where the employee's manager is the hiring manager
4. Employee's manager as recruiter. Requisitions where the employee's manager is the recruiter
5. Every manager the employee has. Same as #3, unless the employee holds several jobs with different managers
6. Employee as a past candidate. Requisitions the employee applied to before being hired
7. The employee's team. Requisitions where anyone reporting to the same manager is the hiring manager
8. Recruiters the employee works with. Every requisition handled by the recruiters on the employee's own requisitions
9. Hiring managers the employee recruits for. Every requisition owned by those hiring managers
In our own workforce model we count at least 14 routes like these from one employment record to a requisition. Each one reaches a different set of requisitions, a different pool of candidates, and a different gender mix. Pick the wrong route and nothing errors out. You get a plausible number that answers a question nobody asked.
This is where "Power BI handles joins" meets HR data. Power BI allows only one active relationship path between two tables. Every other route has to be added as an inactive relationship and switched on measure by measure with USERELATIONSHIP in DAX, or modelled with duplicate copies of the same table. That works for two or three routes. Across a dozen routes and every metric that uses them, it becomes a large layer of hand-written DAX, and the choice of route is buried in code HR can't see.
Data teams can solve this. The test is whether the route is a named, visible part of each definition, for example "candidate gender, for requisitions where this employee is the hiring manager," so anyone reading the number knows which question it answers.
4. Whose definition of turnover is this?
Turnover sounds like a single formula. It isn't. Take a year where you start with 1,000 employees, end with 900, and have 120 voluntary exits:
Average headcount, start and end: 120 / 950 = 12.6%
Ending headcount: 120 / 900 = 13.3%
Starting headcount: 120 / 1,000 = 12.0%
That's three defensible answers before anyone has asked whether interns count, whether a transfer between legal entities is an exit, or whether someone who left and came back in 60 days ever left at all.
None of these choices are hard on their own. The hard part is making one choice and keeping it. In Power BI, measures live in each semantic model, so two report authors can define turnover two ways and both be right by their own logic. Six months in, the leadership team gets two numbers for the same thing. Decide who owns each definition, and how a definition gets changed, before the first dashboard ships.
5. Does access follow the org chart?
People data has the strictest access rules in the company. A manager should see their own org and nothing else. Pay should be hidden from roles that shouldn't see it. Small groups need suppressing, so nobody can work out an individual's salary from a team of three.
Databricks and Power BI both have row-level and column-level security features. The work is mapping them to HR's rules and keeping them current. When a manager moves to a new org, their access needs to move with them that day, not when someone remembers to update a security table. Ask who owns that mapping and how it updates. A mistake here is a pay data leak.
6. What happens when someone asks a new question?
This is the question most build plans skip.
Power BI is designed around two roles. Creators build semantic models and reports. Everyone else, in Microsoft's words, can "view and interact with reports, dashboards, and apps that others create" (Microsoft Learn).
For most HR leaders and business partners, that means they are consumers. They can filter, slice, and drill into what was built for them. With the right permissions and Copilot enabled, they can explore further, but only within the model someone else designed. A new metric, a new hierarchy, or a view of last year's org means going back to the data team.
That's fine if the data team has capacity for HR. It becomes a problem when HR questions queue behind finance and sales priorities, which is where they usually end up.
7. Who owns it after launch?
Build plans usually cover the first release. HR data keeps changing after that: new benefit plans, a new HRIS module, an acquisition, a reorg, a change to how the company counts contractors. Each one touches the model.
Before you commit, write down:
- how many engineers and analysts are assigned to HR data, by name
- what share of their time goes to maintenance once it's live
- what happens to HR requests when those people are pulled onto other work
- how long, from kickoff, until a leader sees a number they trust
Those four answers decide whether the build pays off far more than any feature of the platform does.
8. What will your AI be reading?
Many of these builds are partly an AI play: Copilot in Power BI, Databricks Genie, or an assistant connected to the warehouse. AI tools are only as consistent as the definitions underneath them. Point an assistant at raw tables and it will calculate turnover its own way, and maybe a different way next week.
If you want AI to give your leaders the same answer as the dashboard, the definitions from question 4 and the access rules from question 5 have to be in place first, and the AI has to read through them.
A quick readiness checklist
Before the build starts, you should be able to say yes to these:
- Every change in the model keeps both its effective date and its entry date
- We've decided which metrics are reported "as of" and which "as reported"
- Org history is kept, not overwritten
- Each core metric has a named owner and one written definition
- Every metric that crosses entities (employees to requisitions, managers to teams) names the route it uses
- Access rules come from HR's own structure and update automatically
- Small groups are suppressed in every view
- Specific people are named and budgeted to maintain the model after launch
- HR has a way to add or change a definition without filing a ticket
- Any AI tool reads governed definitions, not raw tables
Build, buy, or both
There are three honest paths.
Build it all. If you have a dedicated data team for HR, and the checklist above is already in your plan, building on your own platform gives you full control and puts HR data next to everything else. Plenty of teams do this well.
Buy a people analytics platform. You get the HR model and standard metrics out of the box, in a separate tool, usually with a data preparation project up front.
Keep your platform and get the HR model delivered into it. This is the path we built Aragorn for. Aragorn connects to your HR systems and maintains the workforce model (effective-dated history, org structures, relationship routes chosen in configuration rather than buried in code, and metric definitions that HR owns and edits), and can deliver that model into your own warehouse. Your data team keeps the lakehouse, Power BI, and full control. They stop rebuilding employment, pay, org, and movement logic that works much the same way at every company, and HR stops waiting in a queue to change a definition.
Whichever path you choose, answer the eight questions first. They are the difference between a dashboard and a number your leadership team trusts.